Decision Science for Better Food Choices
In a world where convenience is king and cravings are instant, how often do we truly stop and think about the cumulative impact of our food choices?
We often choose food habits based on the culture, convenience, and routine we’ve grown with—essentially, habit. But when the availability of choices is added, the decision on what to eat becomes a decision of convenience and craving.
Most of us are aware of good eating habits, but in the moment of instant gratification, we do end up considering transgression as an isolated instance.
The impact of our food choices stretches far beyond our well-being—it shapes industries worth trillions.
Take a look at the numbers that show, just how intertwined our health is with markets.
The Industry Behind Our Food Choices
Consider the scale of the industries involved in shaping our food decisions.
The global human nutrition market was valued at approximately $380 billion in 2023 and is projected to grow to $620 billion by 2031.
In contrast, the processed food industry reached a staggering $2 trillion in 2022,
The pharmaceutical industry, which often deals with the health consequences of poor eating habits, was valued at $1.6 trillion in 2023.
When we break this down further, we see the direct impact of poor eating habits on health costs.
For example, the therapeutic market for cardiovascular diseases is approximately $144 billion, for diabetes it’s $66 billion, and for cholesterol-related illnesses, it's about $31 billion.
Effectively, health issues related to poor eating habits contribute to a $240 billion cost, annually and growing!
The Power of Convenience and Cravings
If we look around us, food choices are increasingly dominated by convenience, packaged food, quick commerce, and food delivery apps, the gap between craving and grabbing that food/ fast snack is shortening.
Add consumerism to this and what we have in our hands is eating disbalance which is leading us and our coming generation to where we don’t envision
But it’s also not just about immediate gratification. Our food choices are shaped by deeply embedded routines and cultural influences, which can make it even harder to break free from habits.
The Psychological Factors at Play
While we are constantly made aware of nutrition knowledge cognitive biases like instant gratification and status quo bias often resist us from moving toward healthy choices.
For instance, the Global Food Policy Report 2024 revealed that 38% of Indians frequently consume fried snacks and processed foods, whereas only 28% manage to include healthy options like fruits and vegetables in their diets.
This highlights the gap between what we know is good for us and the choices we still make in our day-to-day lives.
Study findings demonstrate that eating healthy requires a complex interaction between individual perceptions of food and a sense of control over eating patterns and socio-political and economic structural factors that restrict healthy eating options while promoting unhealthy ones.
Reference: https://pmc.ncbi.nlm.nih.gov/articles/PMC4326591/
Understanding what drives our food choices reveals a complex interplay of psychological, social, and structural factors. Research shows that while health awareness and attitudes are significant, decisions about food often default to convenience, cravings, or deeply ingrained habits shaped by culture and routine
For example, when we are stressed, we reach out for comfort food, a decision more driven by psychological state than the need.
How to Improve Our Food Decisions?
Well, we don’t have to solely rely on willpower to make better food choices. By adopting a decision-making framework, we can start making more mindful, informed decisions that are aligned with our health goals.
In my research I came across many decision frameworks that can help in awareness and food choices, however to keep the simplicity of applicability and so it doesn't get lost in complication, I aligned with the very basic decision making, the ABC model.
"ABC analysis is a strategic inventory management method that classifies items into three categories based on their significance in terms of value and contribution to overall operational efficiency"
It actually stands for Activity Based Costing. The analysis involves classifying items into 3 categories, in their decreasing hierarchy of prioritisation.
Category A with high priority, and higher contribution, and C with the lowest. Simple enough, right?
Although this model is used for cost analysis along with product category, I am keeping that aside for now.
However, it will be interesting to add cost to our food choice analysis to understand the financial impact of the food choices. Maybe we can revisit it and add it as a supplementary study!
Applicability of the ABC model on food choices
Let’s identify food items under the below grouping
Category A: Essentials
These are the foundations of a healthy diet—nutrient-dense foods that should form the bulk of what we eat every day. These foods provide the vitamins, minerals, fibre, and other nutrients our body needs to function optimally.
Examples: Fresh fruits and vegetables (good mix of all colours), Whole grains, Lean proteins, like, chicken, fish, legumes, tofu, Nuts and dry fruits.
These items should make up the largest portion of our diet. Focus on including a variety of colours and types to ensure we are covering all our nutritional bases.
Category B: Good to Have
These foods contribute to our overall diet but aren't nutritionally essential for daily consumption. They add flavour, diversity, and enjoyment, but to be eaten in moderation.
Examples: Dairy products, Starchy Food, Oils and fats
While these items provide valuable nutrients and variety, they’re not as nutritionally dense as Category A foods. They’re best consumed occasionally or in controlled portions to keep a diet balance.
Category C: Treats or Occasional
These are foods primarily consumed for indulgence, offering next to nothing nutritional value but usually are high in sugar, fat and salt.
Examples: Desserts, Fried snacks, Sugary beverages, Fast food
While these foods can be enjoyed in the mildest levels, they should not be the form part of frequent eating habits.
Based on my general understanding, I have assigned a simple percentage to each category to maintain a balance.
While these percentages can vary slightly depending on personal goals, availability, or cultural preferences, they ideally will remain within a close range to the ones below.
Category A (Essentials): 70%
Category B (Good to Have): 20%
Category C (Treats or Occasional): 10%
These weights offer a balanced framework to guide food decisions.
ABC Modeling Workflow
1. List Common Food Items
One can start by listing all the foods we eat, throughout the week. Then,
2. Categorize them
Go through each item on the list and grade it in one of the three ABC categories. Also important to keep the focus on the frequency of each of the items
3. Calculate the % contribution share to understand the opportunity
4. Evaluate and Adjust the Current Diet
Let's look at the simulation built for understanding
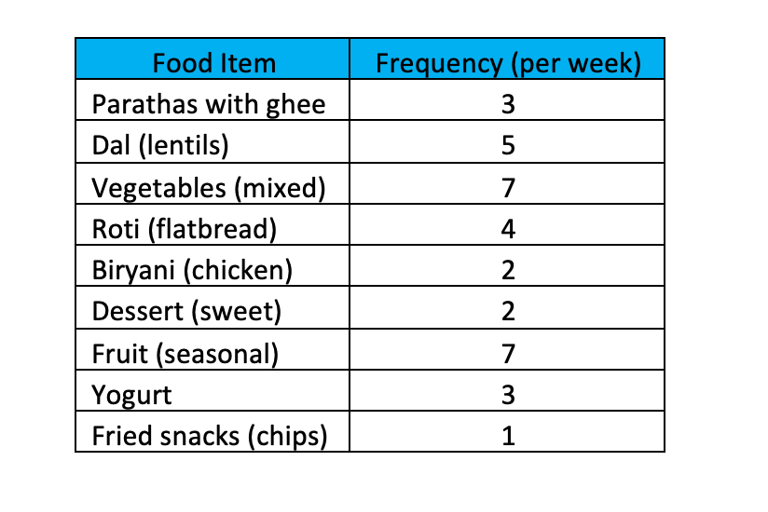
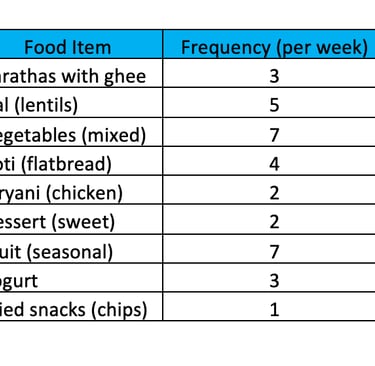
Weekly Food Consumption Data
Step 1: List the Common Food Items
Start by creating a list of the food items we consume throughout a typical week. This could include meals, snacks, drinks, and even ingredients we commonly use.
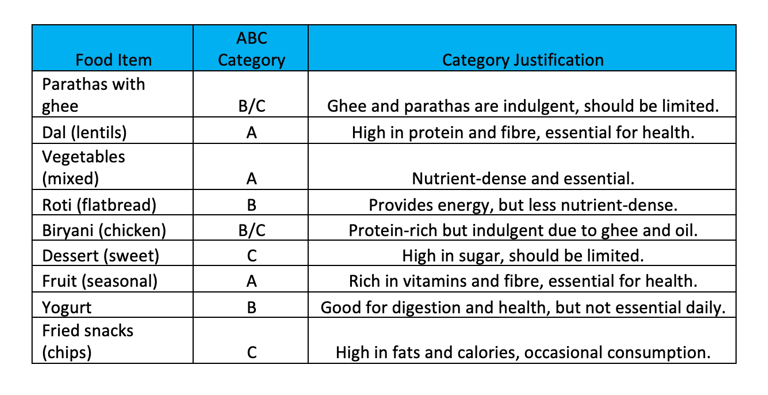
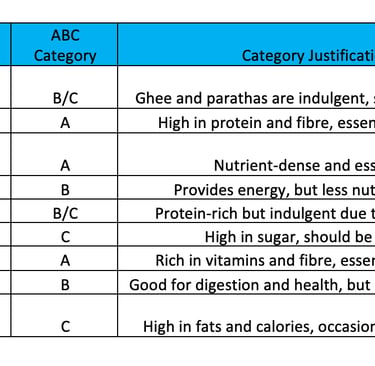
Step 2: Categorize Each Food Item into ABC
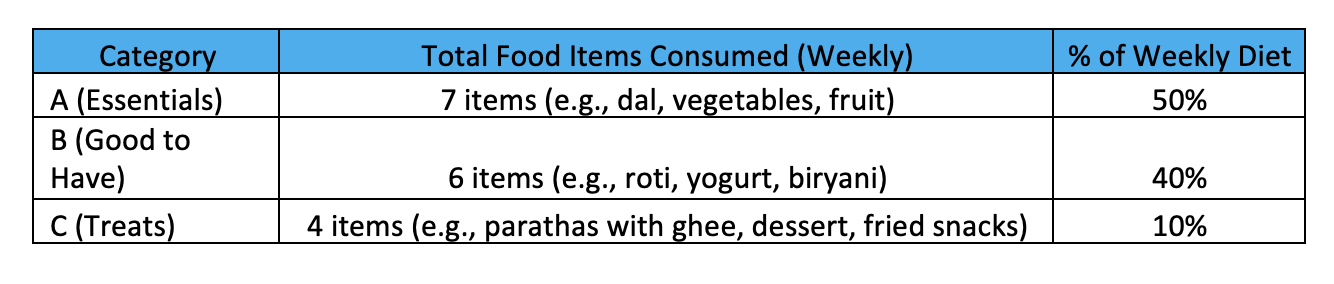
Step 3: Calculate the Consumption Pattern
Now that we have categorized each food item, calculate how much of our weekly food intake falls into each category.
Step 4: Assess and Adjust
After calculating the percentage for each category, compare against the target (e.g., 70% A, 20% B, 10% C) and adjust to correct.
In Conclusion
Based on our goal, we created a simple comparative framework that made it easier to adjust as we gathered more accurate data through a true decision model.
The beauty of this approach is its simplicity, allowing for easy corrections or adjustments when the data becomes clearer.
You may incorporate additional factors, such as cost or calories, which would enhance its effectiveness.
However, the goal wasn't perfection but progress.
Let us start with small changes, and remember that every healthy choice counts. As we gather more data about our eating patterns, we’ll have the flexibility to adjust, refine, and improve!
References
Researchgate: https://www.researchgate.net/publication/26854208_Constructing_Food_Choice_Decisions
NIH: https://newsinhealth.nih.gov/2017/05/how-your-eating-habits-affect-your-health
Enerpize.com: https://www.enerpize.com/hub/abc-analysis-method-definition-advantages-disadvantages
Science.Gov: https://www.science.gov/topicpages/f/food+choice+decisions
NLP for building the simulation.
Image from adobe
© 2025 Decision Design Lab
An Opteria Y Private Limited Initiative